 United States
 Germany
 Spain
Spain
 United Kingdom
 Netherlands
 Austria
 France
 Ireland
 Poland
 Other (EU)
We all know we should be saving for a rainy day (or for retirement, a wedding, a new car, mortgage deposit or one of life’s other great expenses). But how many of us actually do save, what’s the average savings pot of the Great British public and are we retirement ready?
We spoke to British savers to find out the answers to these questions and more, but here are our key findings:
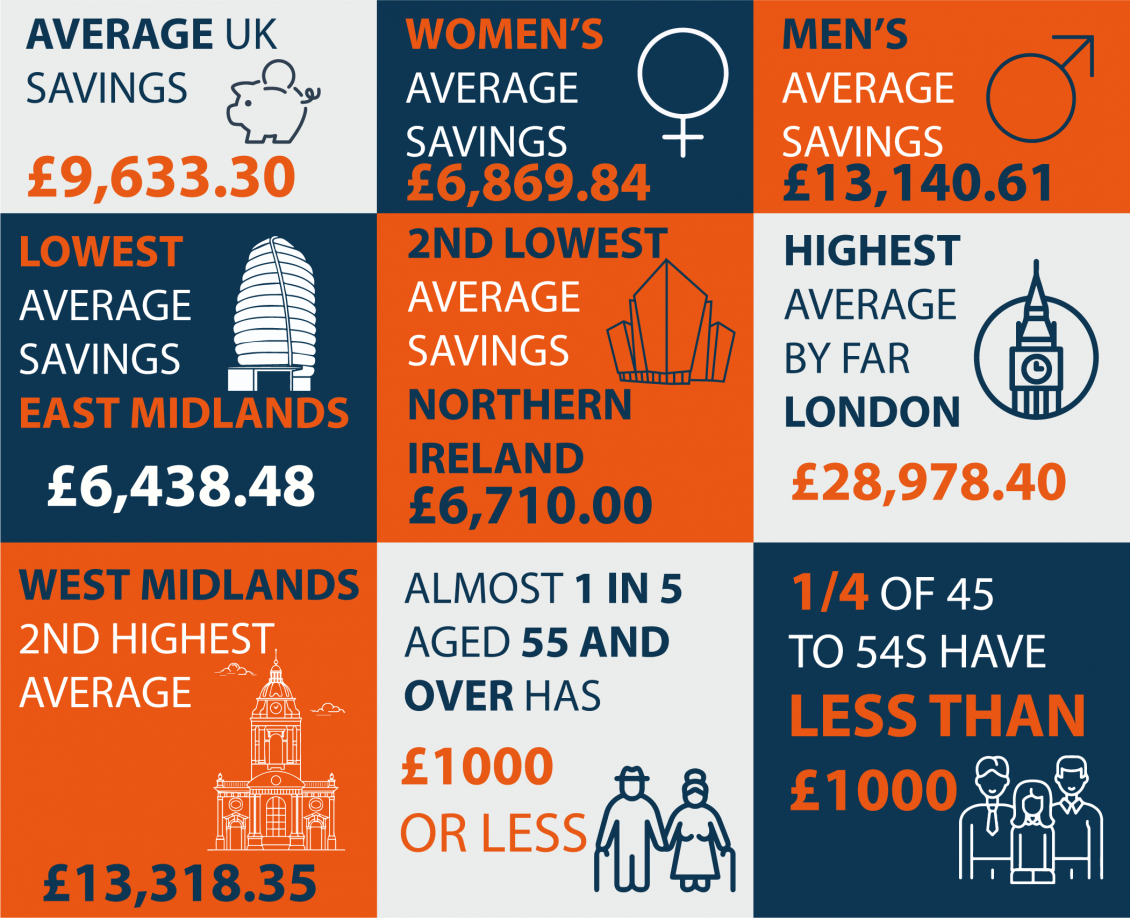
- Average UK savings: The average savings of someone in the UK is £9,633.30
- Battle of the sexes: Men have almost double (£13,140.61) the average savings of women (£6,869.84)
- Lowest average UK savings: The lowest average savings in the UK are in the East Midlands (£6,438.48) followed closely by Northern Ireland (£6,710.00)
- Highest average UK savings: London has, by far and away, the highest average savings with £28,978.40, more than double the next highest-earning location; the West Midlands (£13,318.35)
- Average savings by age: The average UK savings pot for 25 – 34-year-olds is around £3,544.16, compared with £20,028.60 for those aged 55 and over.
Savings statistics in the UK
We carried out research that started with one simple question:
“How much, to the nearest pound, do you have in your savings account(s) today?”
There’s no “one size fits all” when it comes to saving money, but our survey did highlight some interesting trends:
- 6.50% have absolutely no savings
- 25.95% have less than £1,000 in savings
- Although the average savings amount of all people we surveyed was £35,361.09, if we remove the highest and lowest savers from the mix, the middle 66% of people we surveyed have an average savings balance of £9,633.30.
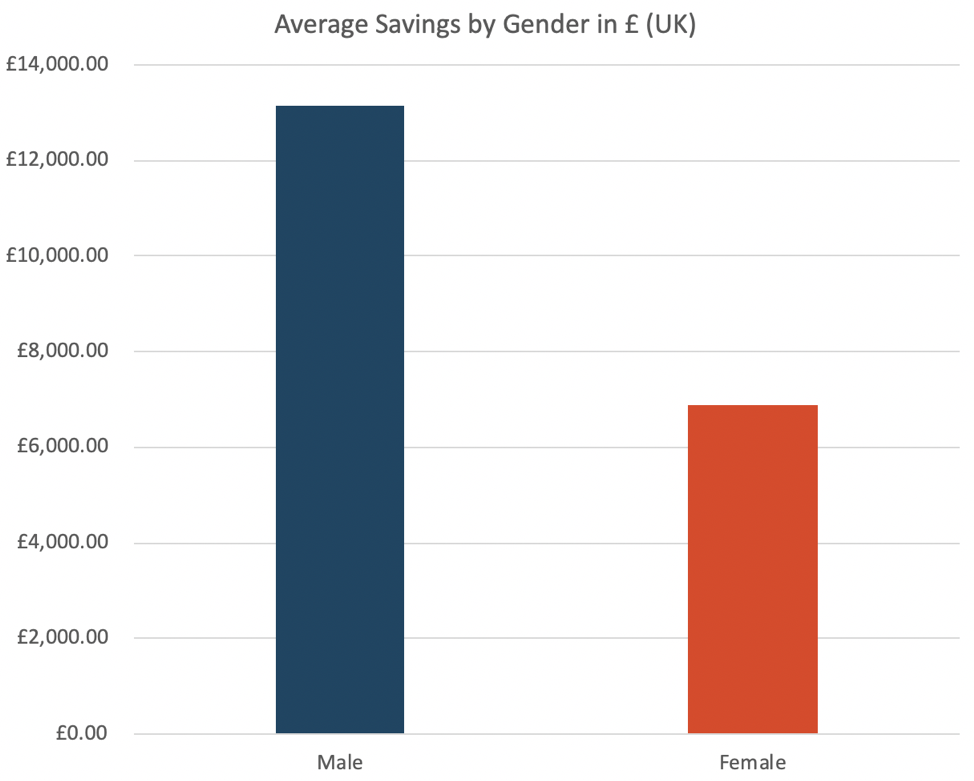
Who saves more; men or women?
Although the trends of savers depending on their age were less surprising (more on that later), it may come as a surprise that there’s a notable difference between how much men and women save. Looking at the middle 66% of people we surveyed, we can see a disparity between male and female savers:
- Women’s overall average savings: £6,869.84
- Men’s overall average savings: £13,140.61
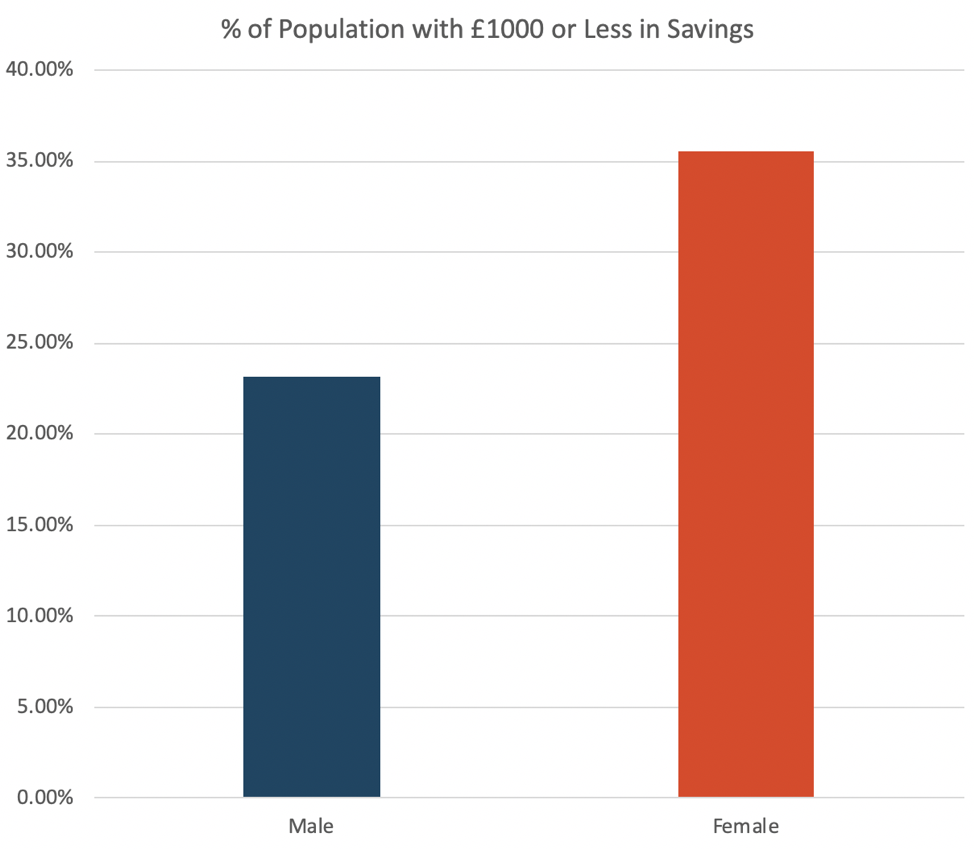
Although men appear to have more saved overall than women, our survey revealed that less than a quarter of men have £1,000 or less in savings, but over a third of women have the same amount.
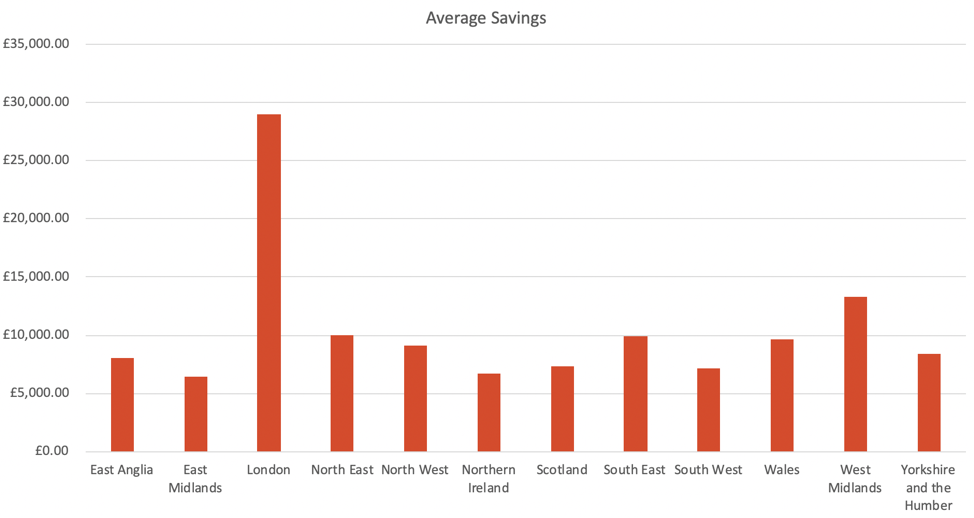
Which region of the UK saves the most?
Exploring where the best savers in the UK are from revealed some unexpected answers, but less surprising was where those with the most savings resided:
Those living in London have more than four times the savings of those living in Northern Ireland.
Here’s what we discovered:
- The lowest average savings in the UK are in the East Midlands with an average savings amount of £6,438.48, followed closely by Northern Ireland with an average savings amount of £6,710.00.
- Londoners have the highest average savings with an average savings amount of £28,978.40, which is more than double the next highest average savings region; the West Midlands with an average savings amount of £13,318.35.
|
|
Average savings |
% with £0 in savings |
% with £100 or less in savings |
% with £1,000 or less in savings |
|
East Anglia |
£8,032.85 |
8.55% |
15.38% |
28.21% |
|
East Midlands |
£6,438.48 |
8.75% |
12.50% |
35.00% |
|
London |
£28,978.40 |
1.48% |
6.67% |
17.04% |
|
North East |
£10,022.58 |
8.89% |
11.11% |
35.56% |
|
North West |
£9,156.79 |
8.20% |
16.39% |
35.25% |
|
Northern Ireland |
£6,710.00 |
6.06% |
9.09% |
27.27% |
|
Scotland |
£7,297.19 |
5.88% |
13.73% |
34.31% |
|
South East |
£9,885.55 |
6.71% |
14.09% |
29.53% |
|
South West |
£7,140.18 |
4.72% |
16.04% |
31.13% |
|
Wales |
£9,648.91 |
9.09% |
15.15% |
28.79% |
|
West Midlands |
£13,318.35 |
5.38% |
10.75% |
23.66% |
|
Yorkshire and the Humber |
£8,406.60 |
7.69% |
19.23% |
32.69% |
Which age group has the most savings?
Unsurprisingly, there was a big disparity when we compared average savings by age in the UK.
As expected, older generations tend to have more savings than their younger counterparts:
|
|
Average savings |
% with £0 in savings |
% with £100 or less in savings |
% with £1,000 or less in savings |
|
18 to 24 |
£2,481.16 |
10.83% |
27.50% |
50.83% |
|
25 to 34 |
£3,544.16 |
12.38% |
21.78% |
42.08% |
|
35 to 44 |
£5,995.92 |
7.91% |
12.99% |
33.33% |
|
45 to 54 |
£11,013.99 |
6.34% |
11.22% |
25.85% |
|
55 and over |
£20,028.60 |
2.23% |
7.59% |
18.08% |
Although the average savings of a typical 30 year-old may be lower than the average savings of someone at 50, age shouldn’t really be a barrier when it comes to building a healthy savings pot. In fact, the earlier you start to save, the more time your money will have to grow. Our handy savings guides can help you get started.
Is the UK retirement-ready?
Judging by our survey data on savings alone, it’s arguable that most of the UK public aged 55 or over is not financially ready for retirement.
Almost 1 in 5 of those aged 55 or over has under £1,000 in savings.
Almost 1 in 5 of those aged 55 or over have less than £1,000 in savings, and although the average savings of this age group is £20,028.60, this amount is less than the average salary of a full-time employee in the UK (around £33,000 according to recent figures).
Of course, this data doesn’t take into account other assets that may contribute to a persons retirement income, but it does show that a large proportion of those at or approaching retirement don’t have significant savings to fall back on.
It’s never too late to start saving
Whatever your age, gender or background, it’s always a good decision to begin saving. One option to consider is locking your money into a fixed rate savings account that offers a fixed rate of interest, so you won’t be impacted by fluctuating rates and your savings will continue to grow.
Survey info
OnePoll conducted a survey on our behalf in December 2019 on a sample of 2,000 people. If you have any questions about our research, please send an email to media@raisin.co.uk.