 United States
 Germany
 Spain
Spain
 United Kingdom
 Netherlands
 Austria
 France
 Ireland
 Poland
 Other (EU)
For many, takeaways are a regular monthly or weekly treat. Despite the current cost of living crisis, people all around the UK are still willing to splash out on getting their favourite cuisines delivered straight to their front door.
Since the beginning of lockdown, takeouts have risen in popularity – whether it’s a cheat day, a get-together, or you’re simply just avoiding cooking, there are an almost unlimited number of choices available at the click of a button (thank you Deliveroo and Just Eat!)
And which cuisine is the nation’s favourite? According to Statistica, 25% of Brits in 2021 stated Chinese was their preferred food to order in, with Indian and Fish & Chips following close behind.
Deliveroo, UberEats and Just Eat are busy day to night delivering mouthwatering crispy noodles, Italian-style pizzas and doner kebabs to individuals all around the UK. The question is, which city takes the crown as the takeaway capital?
We’ve collected data from multiple sources in order to crown the “takeaway capital” of the UK, using information including the number of takeaways per square mile and per 10,000 people in each city. Plus, we look at the cost of takeaways vs a weekly shop and explore whether the number of takeaway shops in each town could be affecting house prices.
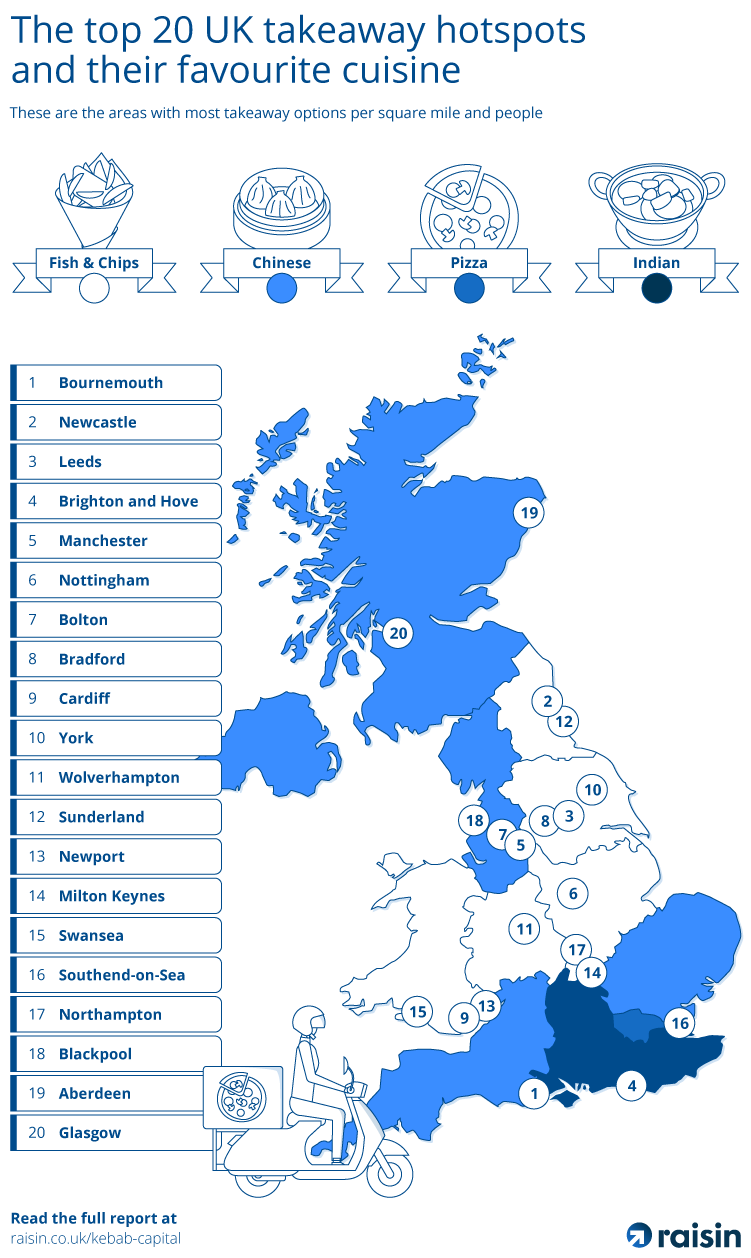
Bournemouth crowned as the takeaway capital of the UK
Known as the largest resort in Dorset, Bournemouth is one of the most popular seaside towns in the South West. Complete with miles of sandy beaches, seaside amusements, vibrant nightlife, and – of course – tonnes of takeaways for visitors and locals alike to choose from. Attracting millions of visitors each year, it’s really no surprise Bournemouth takes the crown of takeaway capital. In fact, the city itself has a whopping 3,992 takeaway food locations, giving it a total index ranking of 82.3!
So, who’s next?
Newcastle is the next top spot for takeouts
Newcastle is runner-up for takeaway capital. With a growing population of 290,688, the Northern city has 2,703 takeout options for its residents to choose from. The city’s huge student population and love for a true British ‘chippy tea’ sit them firmly at second place in our listings, with an index score of 81. Newcastle residents are estimated to spend approximately 3.75% of their disposable income on takeaways – the third highest rate of all cities in the UK.
Leeds takes third in battle for takeaway capital
The Yorkshire city of Leeds comes in as the third takeaway hotspot in the UK, with an index score of 80. Leeds has a massive number of takeaway options for its residents, totalling over 6,700! This is only just behind London and Birmingham and is one of the highest numbers compared to population and city size out of all the cities analysed. On average, Leeds residents spend 3.57% of their disposable income on takeout alone.
Brighton and Manchester round out the top 5
Brighton and Hove take the 4th spot in our ranking, thanks to their high index score of 77.3. Despite only 2.86% of disposable income being spent on takeaways, the famous beach town has the highest number of Deliveroo options per 10,000 people, and the fourth highest number of takeaway locations compared to its population.
Manchester takes the final spot in the top five takeaway hotspots of the UK with a high index score of 76.7. Manchester has over 9,000 different takeaway options across independent stores and delivery services – no surprise, given the high population in this ‘northern powerhouse’. On average, a respectable 3.45% of disposable income is spent on takeout food.
Gloucester are the city LEAST in favour of a takeaway
Situated on the river Severn, South West town and cathedral city Gloucester has the lowest index ranking out of all of the other analysed cities in the UK, at a meagre 22.3. This could be due to its limited number of takeaway locations when compared to other cities, with only 963 takeaways throughout the whole town! That being said, North West London town Watford, which ranks 21st out of all 50 cities analysed, actually has 50 fewer takeaways than Gloucester!
Surprisingly, the average disposable income in Gloucester is fairly high in comparison to many other cities, at £21,222 per year. For example, this matches the average disposable income in ‘takeaway capital’ Bournemouth and is a not-inconsiderable £5,000 more than the average disposable income in second-place takeaway capital Newcastle. Could this suggest that in some cities it isn’t necessarily those with the highest disposable income who are spending the most on takeaways?
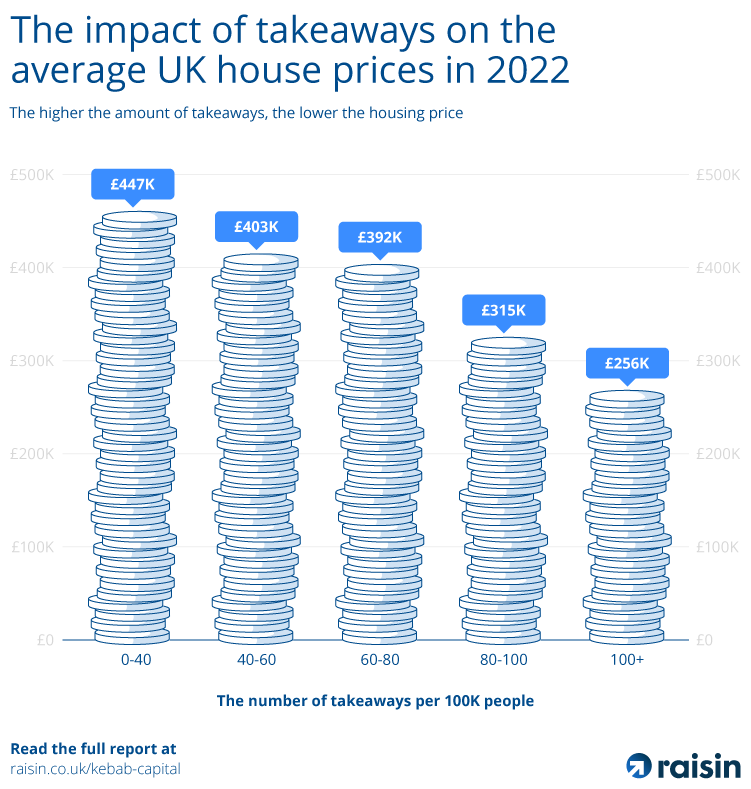
Could takeaways be hurting our house prices?
Thinking of relocating? It probably wouldn’t have crossed your mind that your desired location’s local chippy could have a detrimental impact on your future home’s house price – however, our data has highlighted this actually COULD be the case.
From our findings, we noted that it’s actually the cities and areas with 40 or fewer takeaways that have the highest average house price (which in 2022 stands at around £447,049 – a 10.73% increase from previous years). Interestingly, the sectors with between 60 to 80 takeaways per 100,000 people have seen the highest rise in house prices – a jump of 24.58%, which works out as, on average, a whopping £59,830 price increase in the last two years.
For ‘takeaway capital’ Bournemouth, where there are an average of 201 takeaways per 10,000 people, the cost of a house is around £255,595 – suggesting that the higher the amount of takeaways there are, the lower the housing price.
Meanwhile, the house prices in Gloucester, the area least in favour of the nation’s beloved takeaways, are on average around £392,219, and have seen the highest housing price increase out of our surveyed cities in the past two years!
However, before you pack your bags and move as far away as possible from your local pizza shop, it is important to remember there are a range of wider influences that affect house prices as a whole. Plus if it’s a great, renowned takeaway, it could actually be a selling point for your home!
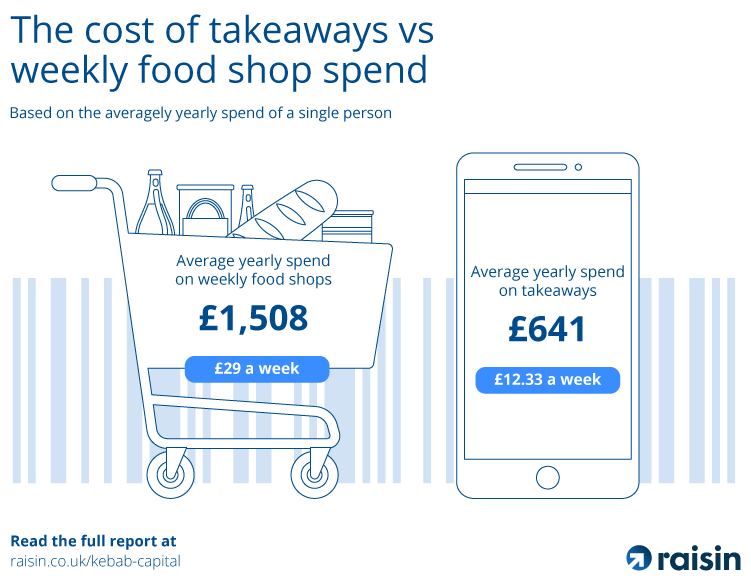
Takeaway vs Weekly Shop
Most of us are guilty of arriving home from our weekly shop with a fridge full of food, to instead kick back, flick on the TV and order an Uber Eats to arrive within the hour. So, how much does the average person actually spend on the weekly shop in comparison to takeaways?
On average, residents in the UK with an annual salary of around £25,971 spend around £641 per household on takeaways each year. This works out as 2.5% of the standard salary spent on takeaways per person! The average person’s yearly spend on their food shop is around £1,508, which works out to be around £29 per week. This means the average percentage spent on takeaways when compared to the weekly shop costs a huge 42.51% more!
Although the average man spends more on their annual and weekly shop than the average woman, it looks like it’s women who are the most likely to order in.
The standard household, which is made up of two adults and two children, on average spends around £5,616 a year on their weekly food shop, which is around £108 per week. This means that the total spend on takeaways is on average 11.4% more than the total spend of a supermarket shop.
Interestingly, it seems it is the smaller households who are spending the larger percentage share on takeaways compared to a weekly shop. For example, our data has highlighted that the average two-person household spends 19.88% on takeaways when compared to their weekly shop.
Looking to make smarter money moves? Find the best savings account for you and compare interest rates on savings accounts and register for a Raisin UK Account.
Methodology
Data was gathered from the number of Deliveroo, Uber Eats, and Just Eat delivery services in each city, in order to find the “takeaway capital” of the UK. We gathered data on the population of each city, the number of takeaways per square mile, and takeout locations per 10000 people in each city.
We additionally looked into house prices in each city to determine if the amount of available takeaways in each area affects current housing prices. Through gathering data on the percentage of the average household disposable income spent on takeaways vs weekly each year, we compared which households and genders are spending the most on their favourite takeout food each year on average.